Who are you, my reader, and how many are you?
The third anniversary of my site, or rather its domain name, is a good reason to review this particular substance. Not that I carefully track the chronology – this is done for me by specially trained people who annually ask for money to renew this very domain.
Of course – if you have made your own site, then wonder: “Does anyone go to it?” And although my site has a special character: not spectacular and news, but reference and encyclopedic, i.e. I didn’t count on crazy ratings and peak loads, but it’s still interesting! At the same time, I did not plan, did not, do not plan and will not make any movements in the direction of promoting the site in search engines.
So at the first stage, I just put the first counter I came across: the Visitor Counter Plugin (there it is in the lower left corner) and calmed down for a while. However, this counter displays two values: current and cumulative. But you can’t compare it with yesterday or a month ago.
Then I did some more searching and settled on the Count Per Day plugin. This is already a more powerful thing and it is private, i.e. available only to the administrator. I will share some of its indicators.
Here is the actual attendance schedule for August 10:
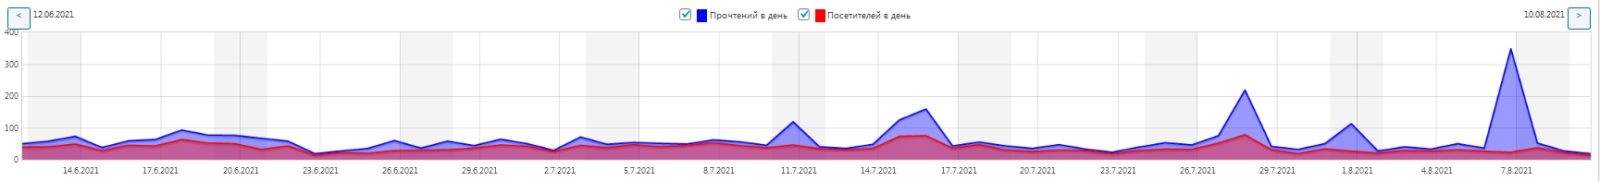
Red – the number of unique visitors, blue – the number of visits. As you can see, the visit is very uneven. Basically, this is no more than 50 visitors (average value – 26 people) per day with peaks of visits by a hundred. The all-time high was on February 15, 2020, with a reading of 288 people per day.
I like the moments when the number of visits is much higher than the number of visitors, i.e. where blue is much higher than red. It seems to me that a person, having got to the site (quite possibly by accident), stays on it looking through more and more new pages. And when these values are almost the same, then an extremely negative scenario for me seems to be – a person accidentally got to the site, he is not interested in him and he immediately left. My peak views were on March 5, 2021 and amounted to 416 reads per day. I was touched by the peak on August 7 in 349 readings: they did not reach the record a bit!
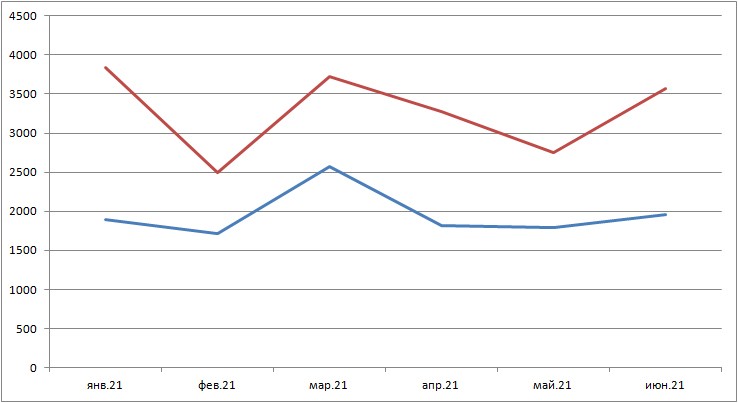
The most important thing (and I was counting on it) is that the number of applicants and visits will grow over time. And so it happened. This can be clearly seen from the monthly attendance graph.
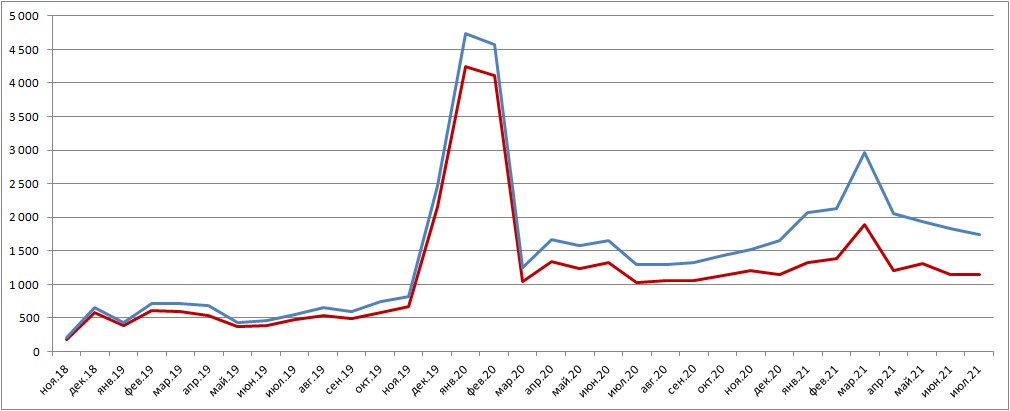
Having started with half a thousand a month, it has practically tripled by now. The most interesting is the incomprehensible peak at the beginning of last year – almost by an order of magnitude, and then, having also fallen sharply, continued the trend towards a smooth increase. What is what?
This plugin displays some more values, but they are not so interesting: which browsers they come from (65% Chrome, 14% Firefox, etc.), from which sites they came (22 times from Google in the last week, 9 from Panzer35) etc.).
Not so long ago I connected to Yandex.Metrica. This is the kind of thing that monitors the activity of the Runet. All the values there are more modest, but the indicators are also prone to growth.
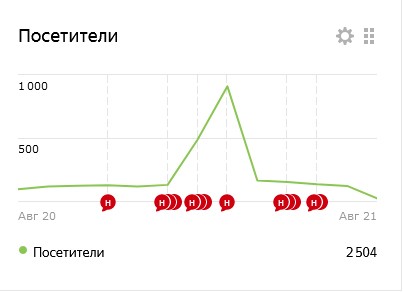
Interestingly, the peak of visits here fell on March 8 of this year, and only Russians amounted to 910 people. Yandex.Metrica also shows from which devices the login was made (46.5% smartphones and PCs, 7.33% – tablets), age of visitors
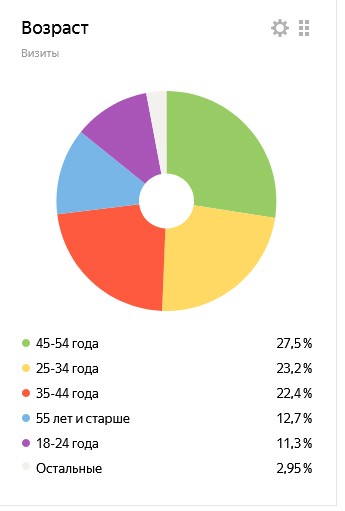
and something else, some of which I don’t really understand.
WordPress also has its own counter in the admin console and its data, for example, for this month, is especially pleasant to me
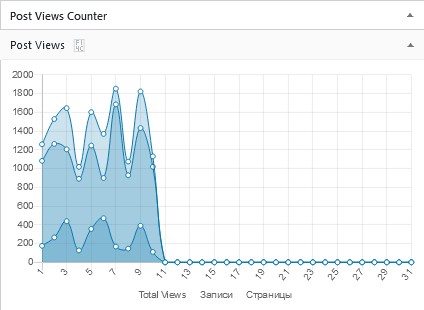
There are almost two thousand visits a day!
And of course the host keeps its own statistics as well. The first half of this year looks like this
It turns out one and a half to two thousand per month, which correlates quite well with the Count Per Day data.
It also keeps statistics on the days of the week (peak – Friday, Thursday and Saturday – the same and half less, at least on Wednesday – half as much), by hour (peak in the period 04-07, though it is not clear what time zone , at least in the period 21-23). In terms of the duration of the visit, there is nothing good for me here: almost 92% fit into the duration of up to half a minute. Those. went in and left almost immediately. Well, okay!
I would be naive if I believed that all these visits are human actions. I understand that a bunch of robots, bots, search engines, etc. are scampering around the site. And users are different, which I am constantly warned about by the Wordfence Security plugin, which I installed on the advice of my youngest son. It is “… an endpoint firewall and malware scanner …“, but I mostly use it as a protection against unauthorized access and spam in reviews. At first, I had 5 login attempts, followed by blocking, now I have reduced this number to 3.
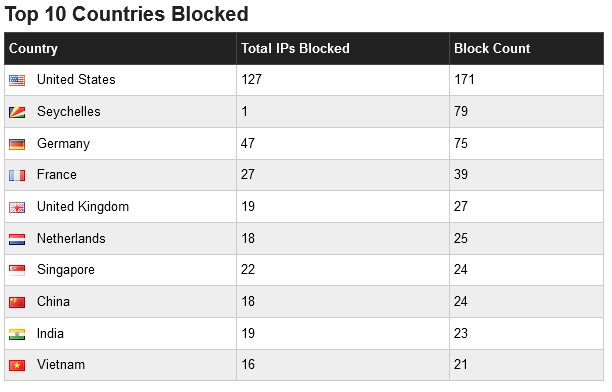
He sends me weekly summary statistics. Here is some data for the week of August 2-9.
Maybe the whole world is being hammered by Russian hackers, but here’s my Russian site hackers from all over the world are trying to break
Moreover, there are stubborn guys who knock repeatedly, despite the blockage of the entrance.
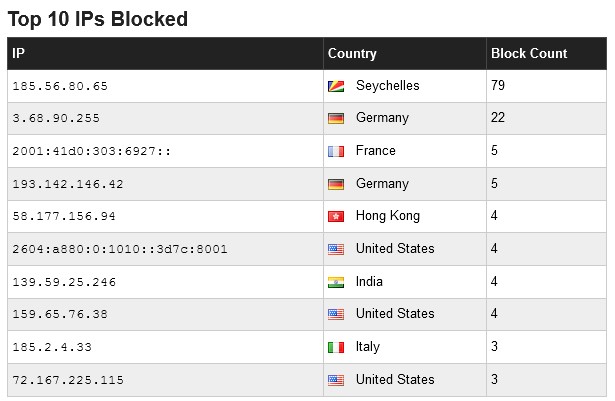
It’s good for them in the Seychelles: it’s warm, palm trees – you don’t need to do anything, just know, break my site!
True, they knock on simple, mainly under the administrator
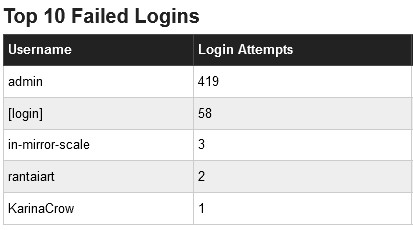
I wonder who KarinaCrow is?
The funny thing is that the attempts of foreigners are doomed to failure: my password is not only very long, but also in Cyrillic!
PS The devotion of time and attention to the site led to some constructive changes in it. Since I already have 11 kitographies (and there will be more), one shelf with them turns out to be somewhat long. Therefore, as in decent libraries, I split them into topics with individual placement of each.